This month we are looking at data on pandemic impacts in Canada.
Shifting Remote – Productivity and Preferences
Perhaps one of the most talked about effects of the COVID-19 pandemic has been the overwhelming and almost overnight shift to remote work that occurred at the beginning of the pandemic, forced by public health measures and restrictions. Over two years later, remote work and the controversy surrounding it has stuck around, particularly the controversy around productivity, with managers and workers often butting heads over this point.
In April 2021, about a year after the pandemic began, two researchers at Statistics Canada, Tahsin Mehdi and René Morissette, published an article on COVID-19 and remote workers’ productivity and preferences – “Working from home: Productivity and preferences”. It is important to note this study used a supplement to the Labour Force Survey of February 2021 focusing on new teleworkers, so the data presented is not representative of those who were already working from home or were not working from home.
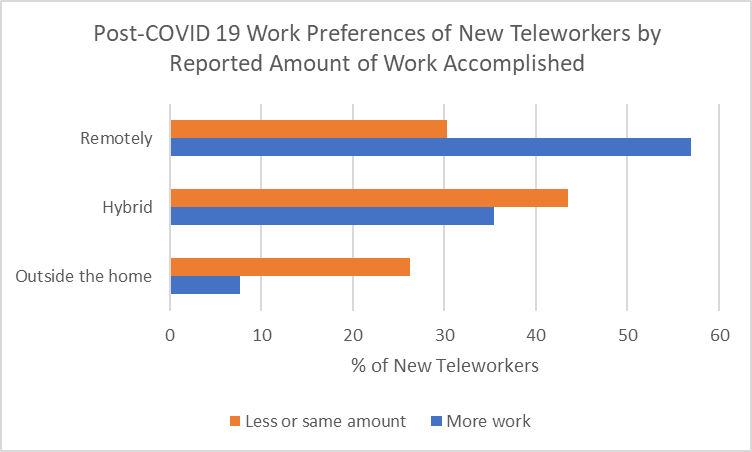
In the study, Mehdi and Morissette found 90% of workers reported being at least as productive as they had been in their usual place of work, with 32% of that group reporting accomplishing more work per hour. The remaining 10% reported accomplishing less. But, of this portion reporting accomplishing less, 44% of these reported working longer hours. Interestingly, as this is often at the center of the remote work controversy, of those 44%, almost 25% reported a “lack of interaction with co-workers” as their main barrier to productivity. The other unique data point from this study centers around the amount of work reported being accomplished per hour by employee by firm size, as seen in the chart below.

While there was no data point available for “less work” for firms of less than 20 employees, what stands out is that it is in these small firms, workers seemed to most maintain the amount of work accomplished in their prior work location compared to working remotely – speculatively, is this a result of the work culture in smaller organizations?
Preferences for remote work were quite split, with 20% preferring to work most or all hours outside the home after the pandemic, 41% preferring a hybrid model, and 39% preferring most or all hours remotely. Not surprisingly, of those who reported accomplishing more work per hour, 57% preferred to remain working remotely, while of those who reported accomplishing the same or less work per hour, only 30% preferred to remain working remotely.
If you’re interested, check out the second article Mehdi and Morissette published on this topic – “Working from home after the COVID-19 pandemic: An estimate of worker preferences”.
The Retirement Hypothesis for Post-Pandemic Reductions in Service Levels
Back in June there was a lot of outrage over service levels at Canada’s airports. The airlines blamed “soaring demand for travel”. But was there really?
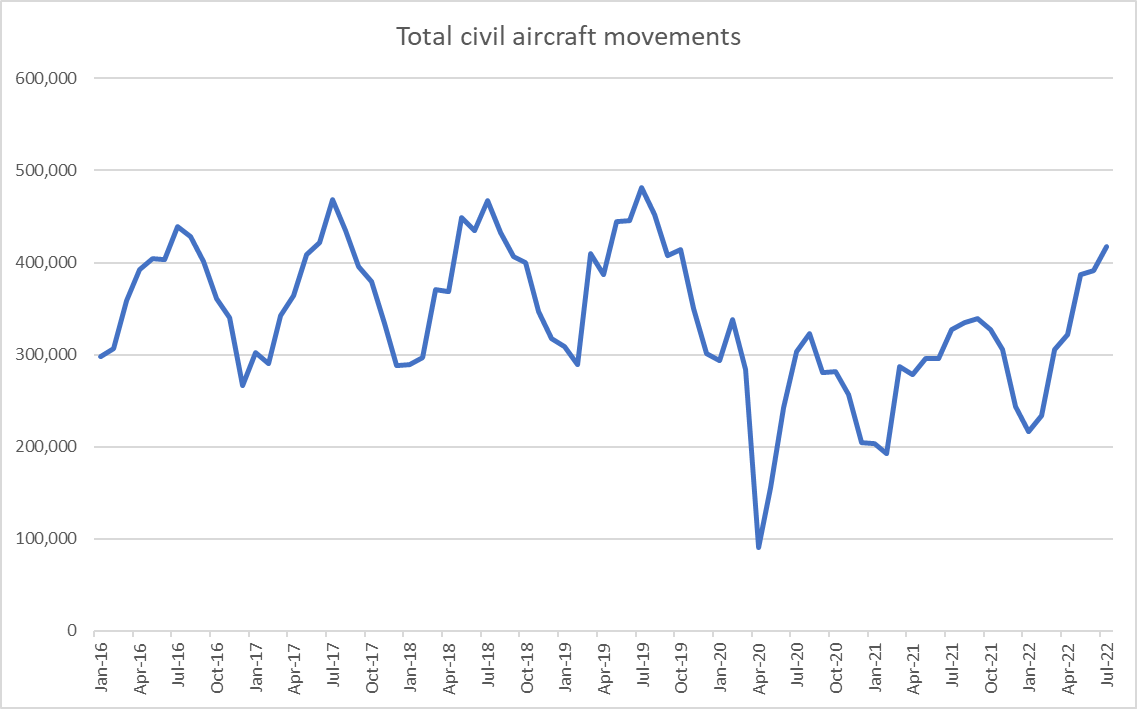
As you can see, civil aircraft movements have yet to reach the 2019 peak. In fact, 14% fewer aircraft were moved in July 2022 compared to the 2019 movements in the same month. There have also been reports about it being difficult to get a passport. Closer to our home, our local water park has only been open four hours a day.
This all begs the question: why are we experiencing these reductions in services? One often cited explanation is that those close to retirement age may have retired earlier than normal during the pandemic or that younger people may have left the workforce during the same time period. To test that hypothesis, we looked at the participation rate across various age ranges in Canada.
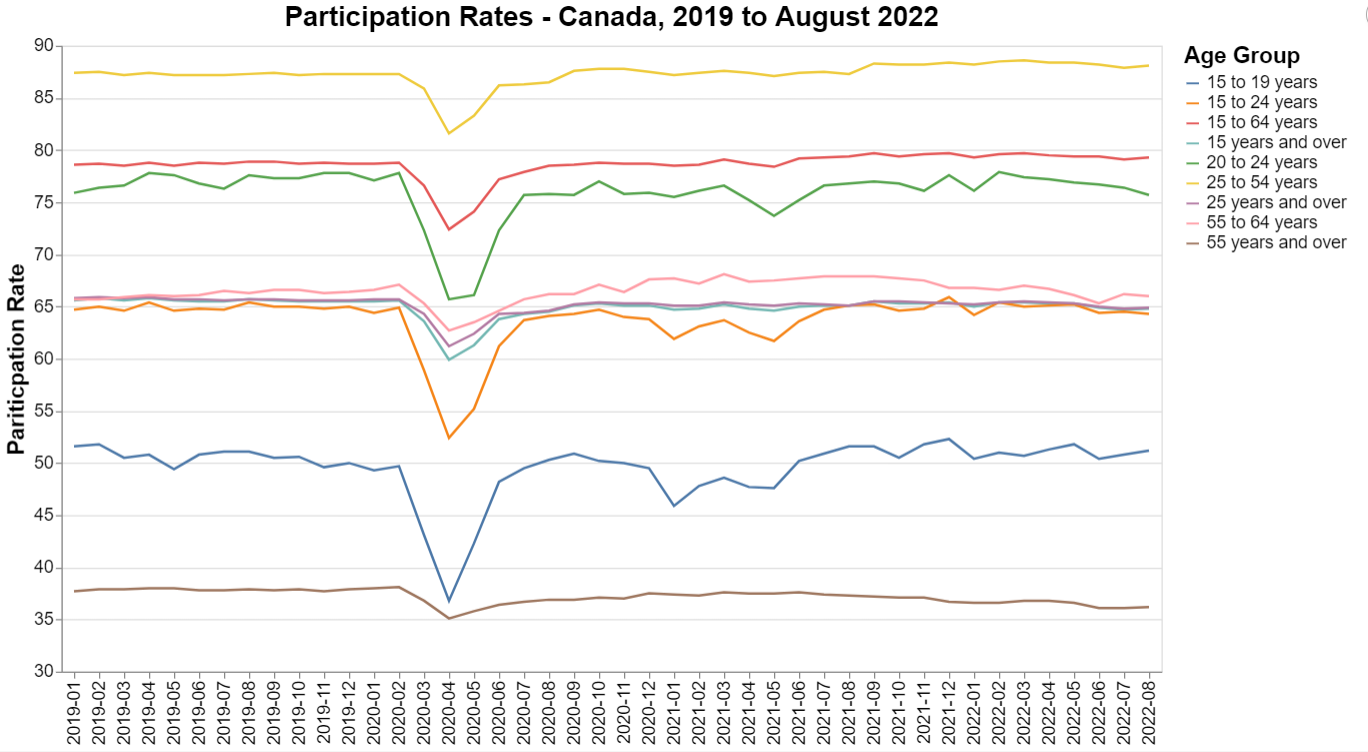
As you can see, after the pandemic blip of early 2020, participation is at about what it was pre-pandemic. So, there haven’t been mass retirements or dropping out of the workforce.
Cross Border Travel
COVID has a major and immediate impact on cross border travel and the implementation of the ArriveCAN app was seen by many as a major impediment to moving to the new normal. Statistics Canada has a great database of cross border data for wide range of types of travel, locations of origin and In order to understand the impact on border crossing that is updated monthly with a 3 -4 month lag time.
At the time of recording there was data upto July of 2022 and to frame the context
| Region of Residence | Jul-19 | Jul-20 | Jul-21 | Jul-22 |
| United States of America residents | 3,615,631 | 113,414 | 194,799 | 2,193,729 |
| Americas, countries other than the United States of America | 157,955 | 7,323 | 9,842 | 96,836 |
| Europe | 528,577 | 9,995 | 27,991 | 371,232 |
| Africa | 24,656 | 1,111 | 3,594 | 17,948 |
| Asia | 326,575 | 8,977 | 21,501 | 106,162 |
| Oceania | 59,968 | 947 | 731 | 28,969 |
Visualized the same period of time looks like this.
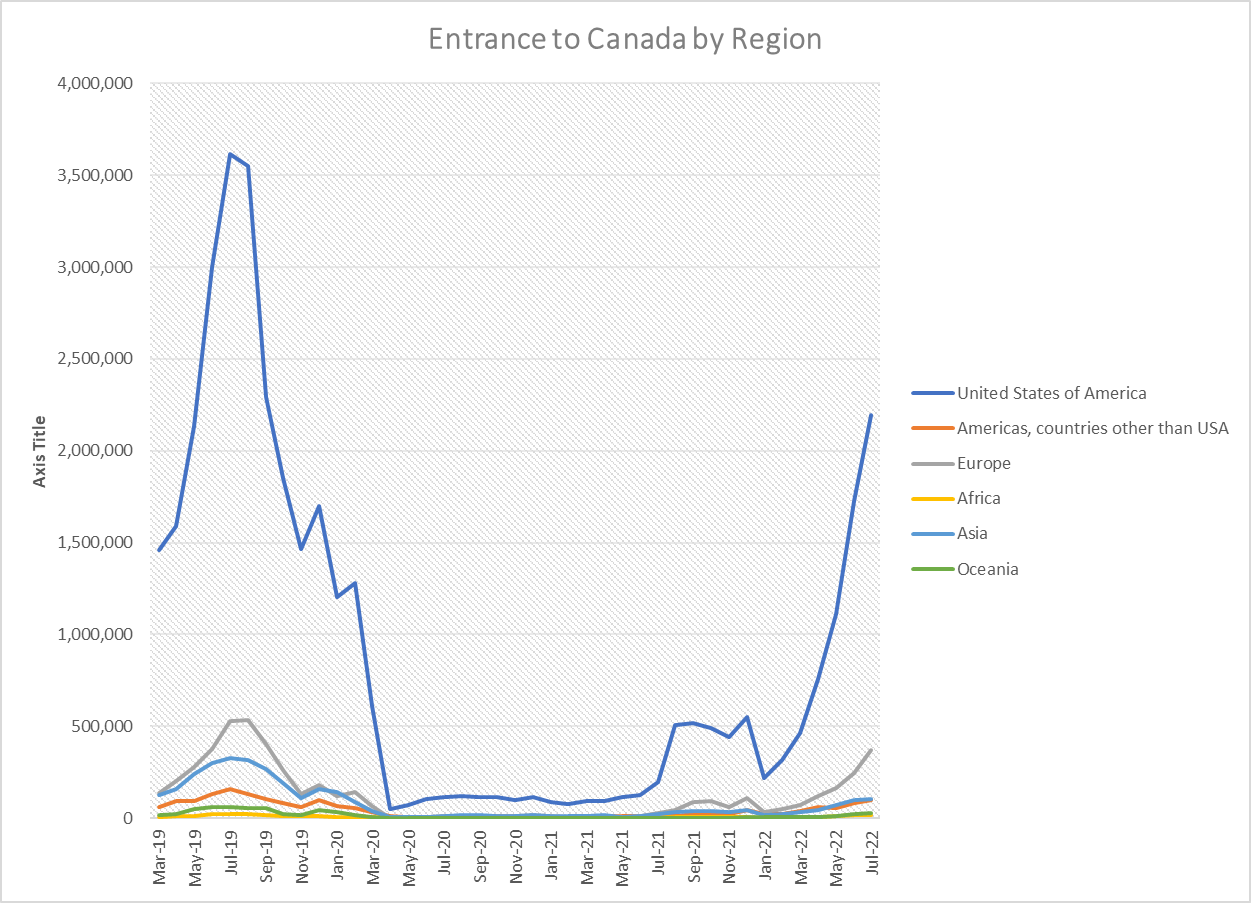
The impacts of the pandemic are clear and the rapid collapse of travel in early 2020. That being said, on a monthly basis over 100,000 Amercians were crossing the border when it was “closed”. Even at the lowest point of travel April 2020 – over 67,000 people entered Canada – 51,000 from the US.
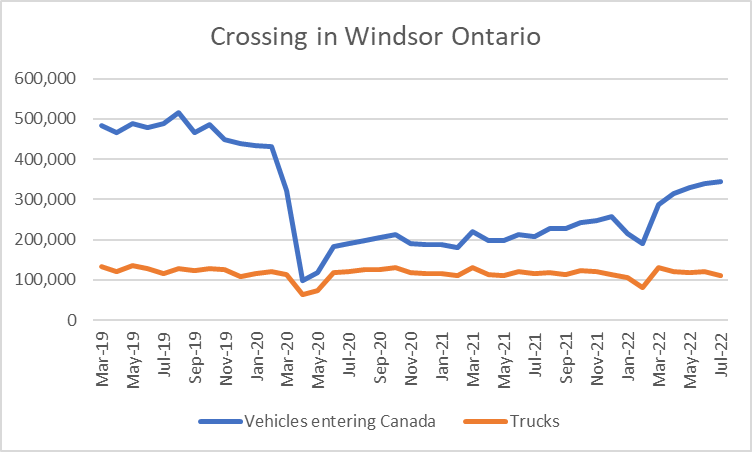
This data can be broken out in a number of ways include the method of travel, country of origin and the border crossing community in Canada. As we live in Windsor Ontario I pulled total car vehicle traffic as well as trucks breaking out trucks originating in both Canada and US.
The impact of COVID closing the border is clear but the limited change in truck crossings at the border certainly raises an eyebrow. Despite halfing approx 120k crossing to 60k from March to April 2020 but June 2020, truck traffic returned to pandemic levels. The other dip that occurred in Jan 2022 was of course due to the occupation and blockade of Huron Church road leading to the Ambassador Bridge as part of the convoy protests. Approximately 24,000 fewer trucks cross the border that month.
There is a lot of robust data in this dataset it goes back to the mid 2000s in some cases further. There are a number of uniques to cut the data for example I was curious how many visitors arrive in Canada by water?
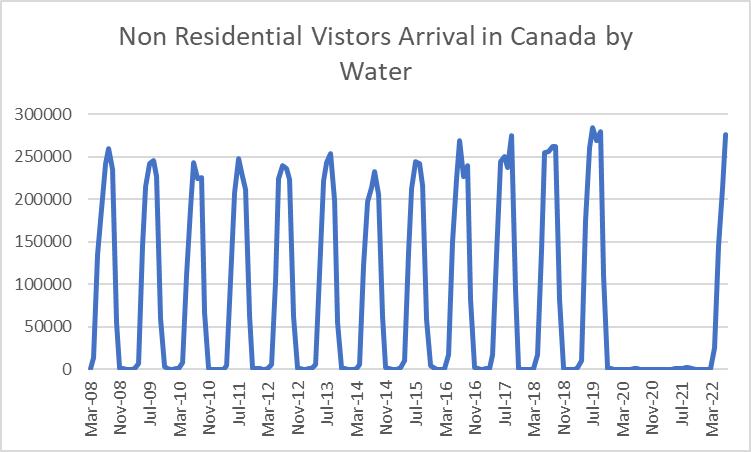
I was surprised to find that a quarter million people per year in (non covid years) arrive in Canada that way.
Finally, for fun, there is travel from Antarctica and Adjacent island region here is the monthly entrance to Canada. The recent surge from this during the May – July of 2022 coincides with the South American winter so I am curious if a research team returned or something.
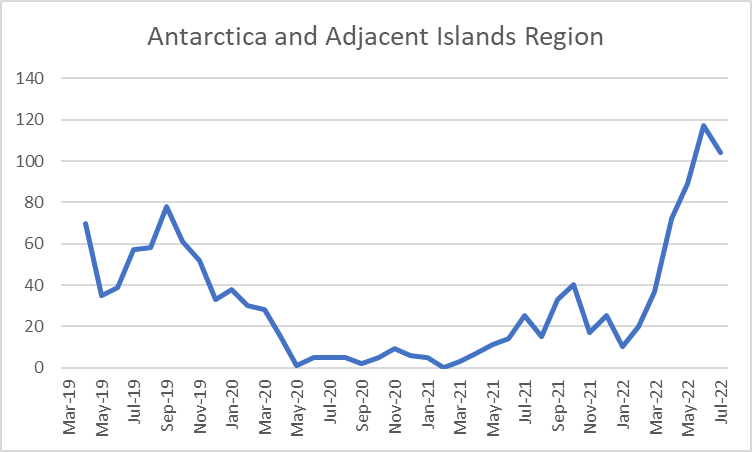
I hope they are bringing penguins with them!
Retail Commodity Sales
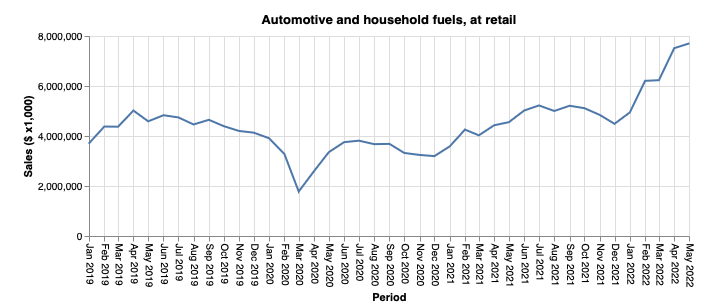
The direct economic impact of the pandemic was felt most by the folks on the frontlines of the economy: owners and workers in the retail and hospitality sectors. With many regions of the country under some form of lockdown, it was inevitable that these sectors would face challenges. We took a look at Statistics Canada Table 20-10-0017-01, which is the monthly retail sales section of the retail commodity survey. It breaks down sales into broad categories of the North American Product Classification System, or NAPCS. We created an interactive chart that allows you to choose a NAPCS and see the sales figures from January 2019 to May of 2022. It is based on a survey, so there is some possibility of sampling error here, and the data is not presented in constant dollars so inflation must be kept in mind when reviewing it. Price changes are reflected in this data as well, which makes it difficult to measure sales volumes in commodities with highly volatile prices like automotive and household fuels, although the dip in March 2020 when nobody was moving is quite noticeable:
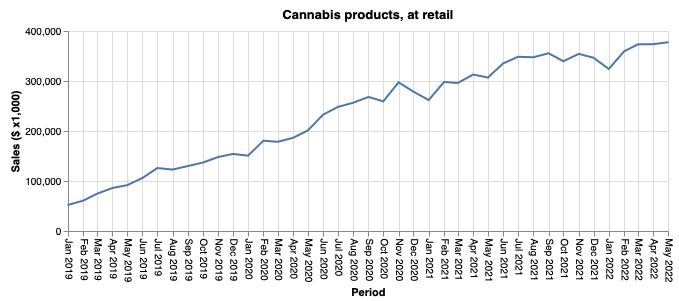
Some categories of retail commodity seemed to be mostly pandemic-proof like cannabis products at retail, which has a steady growth trajectory and only a small dip in the period March-May 2020.
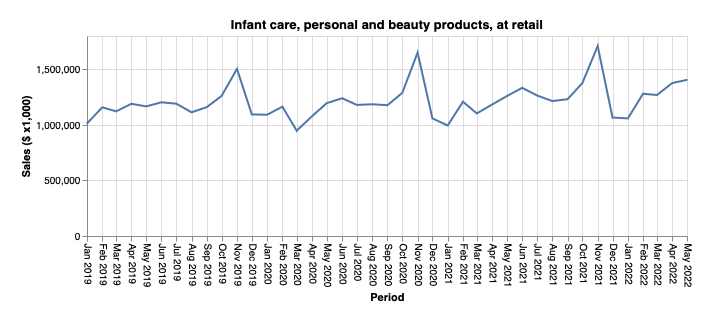
Infant care, personal and beauty products saw a brief dip in March of 2020 but not much deeper of a trough than you see in the typical seasonal distribution of sales. Many of these products are necessities and that most likely served to keep sales figures healthy.
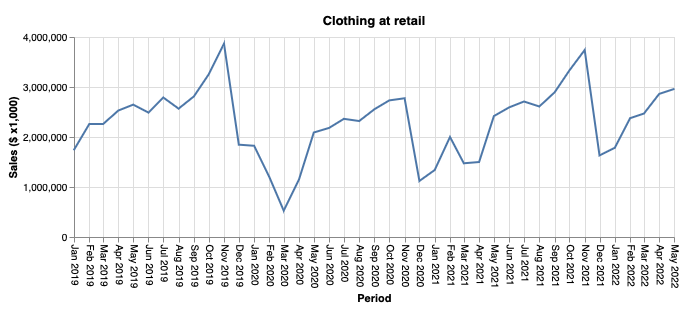
One area where there was a sustained change across the entire pandemic period was clothing at retail, presumably because this is one of the products that people really want to buy in a physical setting.
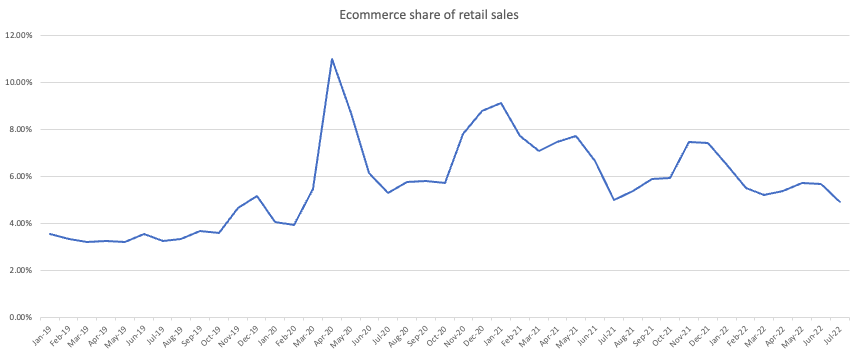
These results got us curious about the relative share of retail sales that were done via e-commerce and fortunately Statistics Canada provides this information in table 20-10-0072-01. We took the raw data and converted it to a percentage to see how e-commerce has fared as a percentage of all retail sales over the pandemic period. It does look like there has been some lasting impact on brick-and-mortar retail as e-commerce sales were under 4% of all retail sales prior to the pandemic and now rarely dip below 5%.